


Project Overview
Objective of the Project:
The objective of the Customer Churn Prediction and Analysis project is to:
Identify customers likely to churn using machine learning techniques, enabling businesses to take preventive measures.
Provide insightful data analysis through visualizations to understand customer behavior, key trends, and reasons for churn.
Enhance decision-making with an interactive and user-friendly web application that integrates prediction and data analysis tools.
Steps to Implement the Project:
1. Data Collection and Preprocessing
Collect Data: Gather customer-related data from a reliable source (e.g., company database or publicly available datasets).
The dataset should include features like customer demographics, subscription details, usage behavior, and churn indicators.
Data Cleaning: Handle missing values, outliers, and inconsistent data.
Feature Engineering:
Encode categorical variables (e.g., gender, region) using techniques like one-hot encoding or label encoding.
Scale numerical features using standardization or normalization.
Data Splitting: Divide the dataset into training and testing sets, typically in an 80:20 ratio.
2. Exploratory Data Analysis (EDA)
Perform statistical analysis to understand feature distributions.
Use visualization libraries (e.g., Matplotlib, Seaborn) to explore relationships between features and the churn variable.
Identify trends or correlations that might impact churn predictions.
3. Machine Learning Model Development
Model Selection: Choose algorithms such as Logistic Regression, Random Forest, Gradient Boosting (XGBoost, CatBoost), or Neural Networks.
Model Training: Train the model using the training dataset and evaluate performance on the test dataset.
Evaluation Metrics: Use metrics like accuracy, precision, recall, F1-score, and AUC-ROC to assess model performance.
4. Flask Web Application Development
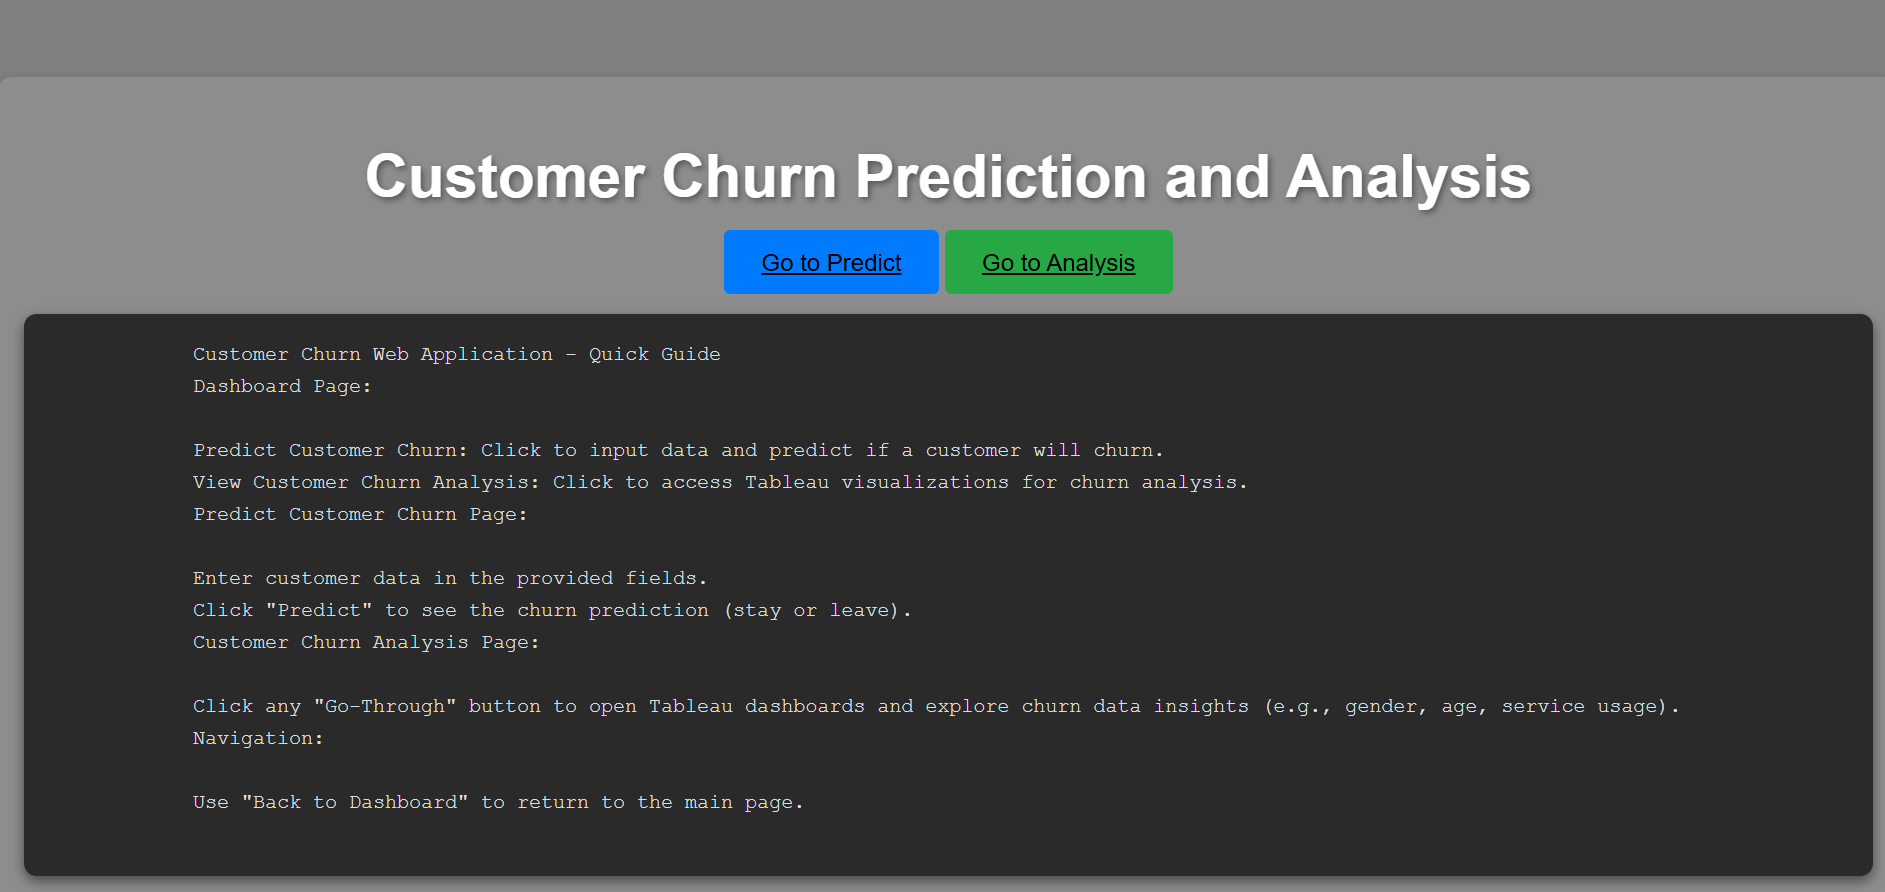
Frontend: Create a user-friendly interface with HTML, CSS, and Bootstrap.
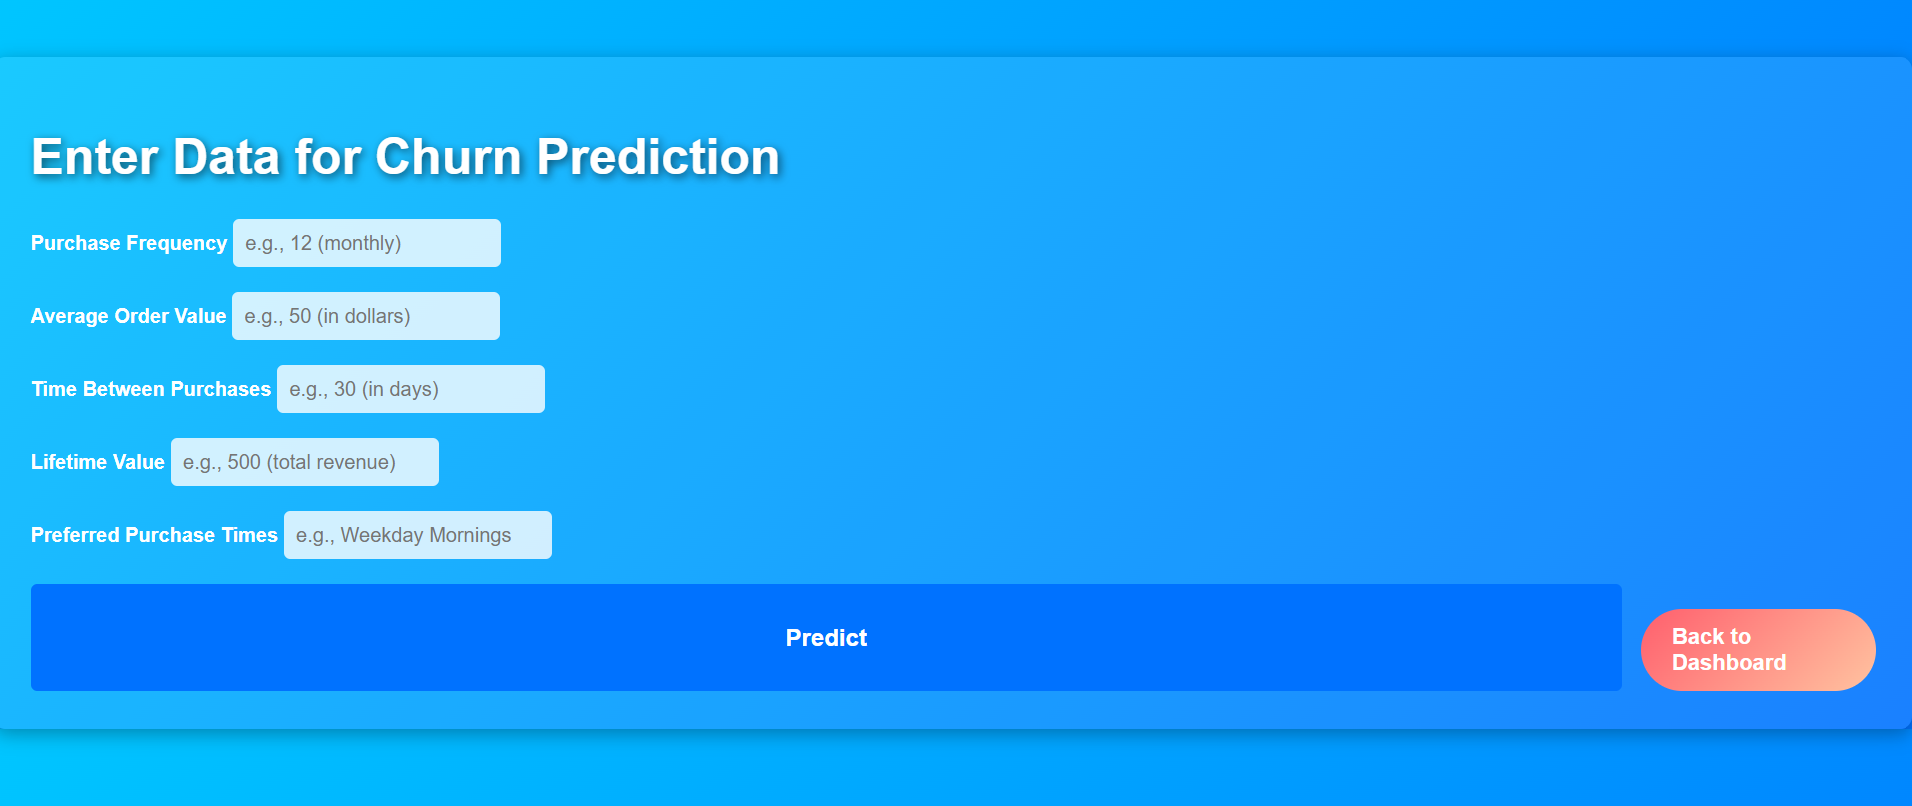
Add input fields for customer data entry.
Include buttons for churn prediction and accessing the Tableau dashboard.
Backend:
Use Flask to handle form submissions and run the machine learning model for predictions.
Integrate the prediction output and display it to the user.
Integration: Link the Tableau dashboard through a clickable button in the web app.
5. Data Visualization with Tableau
Create a Tableau dashboard with key metrics and visualizations (e.g., customer segmentation, churn trends, revenue impact of churn).
Host the Tableau visualization on Tableau Public or a private Tableau server.
6. Testing and Deployment
Test the web application for various input scenarios.
Deploy the Flask app on a cloud platform (e.g., AWS, Heroku, or Azure).
Output of the Project:
1. Prediction Results:
Users input customer details in the web application.
The ML model predicts whether the customer is likely to churn and displays the result (e.g., "Churn Likely" or "No Churn").
2. Interactive Tableau Dashboard:
A comprehensive visualization of customer data, including:
Churn rates by demographic factors.
Monthly churn trends.
Features contributing to churn.
Users can interact with visualizations to gain deeper insights.
3. Web Application:
An easy-to-navigate interface providing two key functionalities:
Customer Churn Prediction: Input-based churn predictions.
Data Analysis: Access to the Tableau dashboard for detailed insights.
Tools Used
HTML
CSS
Flask
Python
Machin Learning
GIT
Tableau
Power BI
Data visualization
Data collection
Data preprocessing
Data Modeling
Prediction
WTF Form